Since we added the very first Achievements Rates report to PICS (formerly Success Rates or QSR) we've had many requests for an interactive version of the report. We're pleased to announce that we've now released improvements to the PICSWeb reports which make it possible for you to save Achievement Rates data then view it using our Interactive Report viewer.
Saving the Data
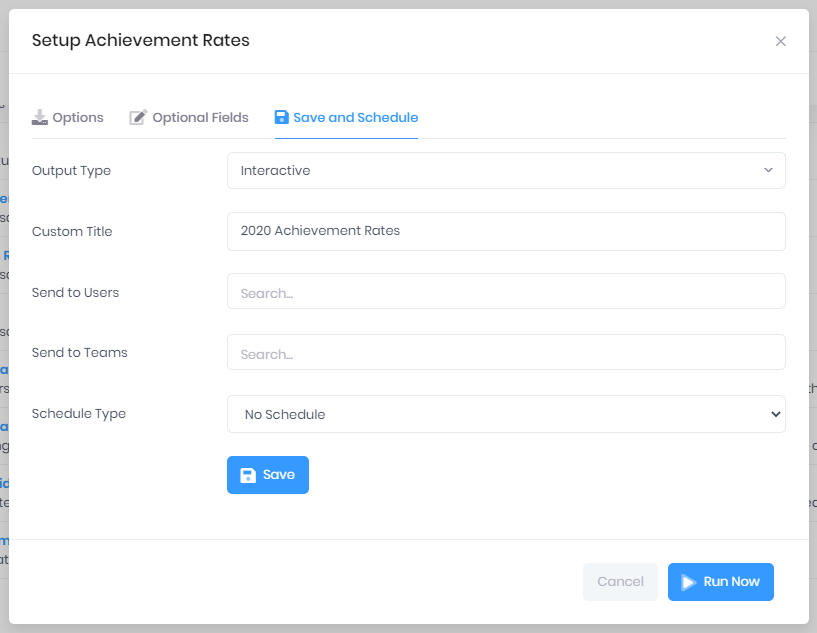
When creating a new report from the Report Templates tab we've added a new Output Type option where you can select Interactive. When you run the report, the data becomes available on the Available Reports tab for instant access using the Interactive Report viewer.

You can save Achievement Rates data using the Qualification & Achievement Rates Report template - you will need to select Overall or Timely if you want to use the interactive report viewer, and add any Optional Fields you'd like to use when you are analysing the data.
Viewing the Achievement Rates
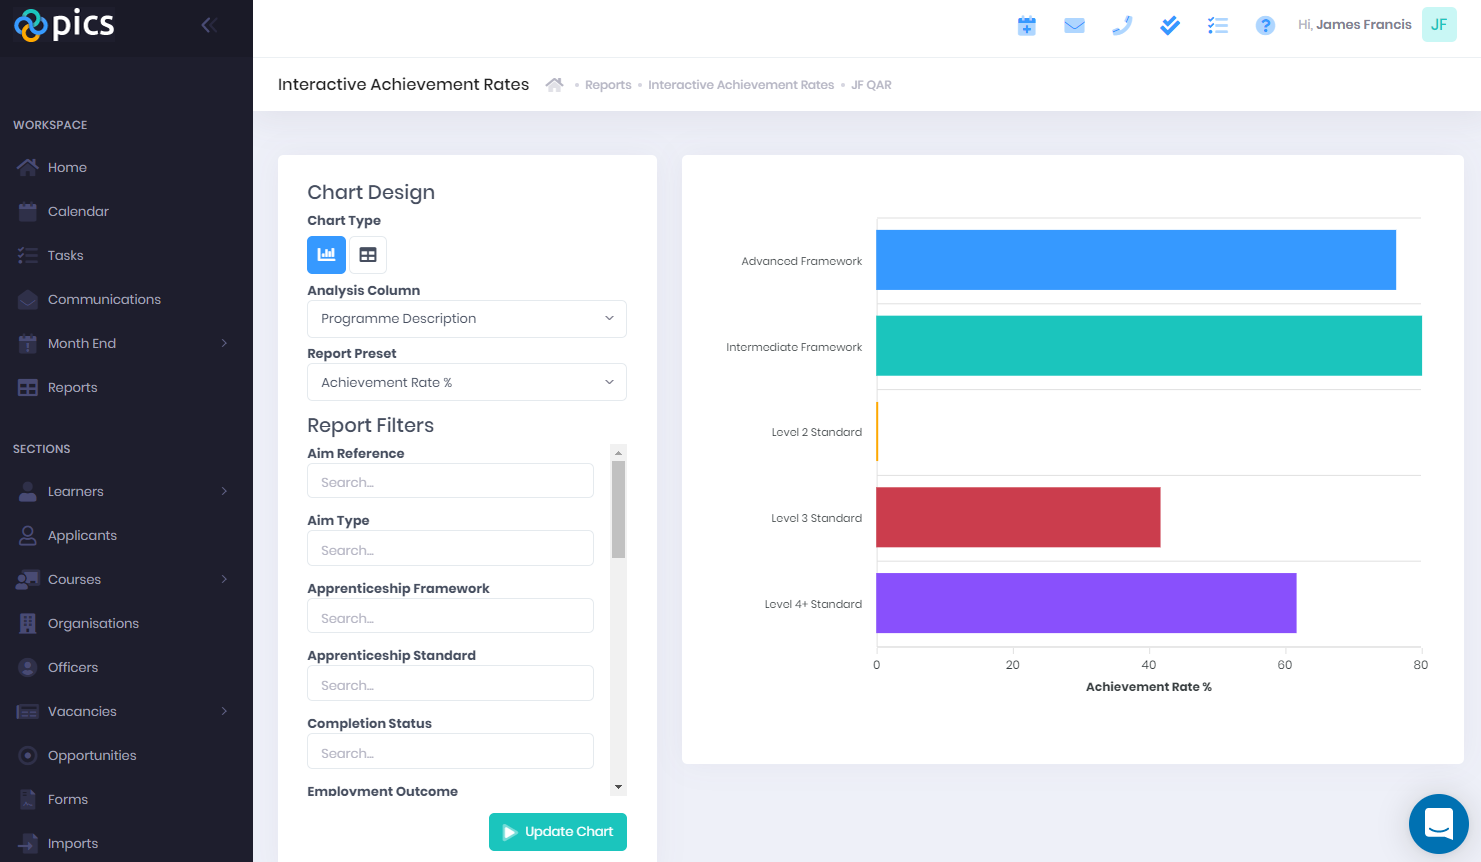
Once the report data is prepared, the achievement rates can be viewed in the report viewer. Select how you'd like to analyse the data and the Report Preset (achievement rate percentage or count of aims in the cohort), click Update Chart and you will see a chart view of the data.

Only interested in achievement rates for certain groups of learners or aims? You can also instantly filter the chart data using the report filters on the left.
To get a full breakdown of the data, simply click the bar in the chart and a list of relevant aims will pop up along with all the data PICSWeb has used to calculate the achievement rate, providing full accountability of the calculated totals.
The improvements to Achievement Rates are available now in PICSWeb and our help guide has instructions for Saving Interactive Reports and running the Qualification and Achievement Rates report.


